Mastering Pivot Tables in Excel: A Step-by-Step Guide
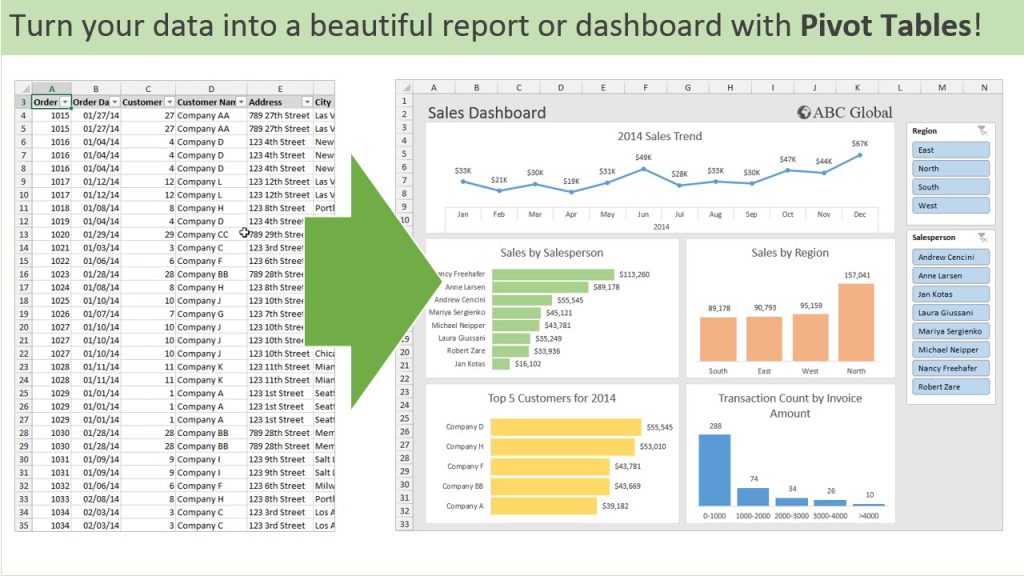
Pivot tables are an incredibly powerful feature in Excel that allows you to summarize, analyze, and present large datasets in a meaningful way. Whether you’re a business professional, a student, or just someone looking to organize data, pivot tables can save you time and provide valuable insights. In this guide, we’ll walk you through the process of creating and using pivot tables in Excel.
What is a Pivot Table?
A pivot table is a data summarization tool that automatically sorts, counts, and totals data stored in one table or spreadsheet. It allows you to transform rows into columns and vice versa, making it easier to analyze data from different perspectives.
How to Create a Pivot Table
- Prepare Your Data
- Ensure your data is organized in a table format with headings for each column. This helps Excel recognize and categorize the data correctly.
- Remove any blank rows or columns to prevent errors.
- Insert a Pivot Table
- Select any cell within your dataset.
- Go to the Insert tab on the Ribbon.
- Click on PivotTable in the Tables group.
- In the Create PivotTable dialog box, choose the data range and specify where you want the pivot table to be placed (new worksheet or existing worksheet).
- Build Your Pivot Table
- Pivot Table Fields Pane: This pane appears on the right side of the screen. It includes a list of all the column headings from your dataset.
- Drag and Drop Fields:
- Rows: Drag the fields you want to analyze into the Rows area.
- Columns: Drag fields here to categorize your data into columns.
- Values: Drag fields here to display numerical data (e.g., sales figures). You can summarize the data using functions like SUM, COUNT, AVERAGE, etc.
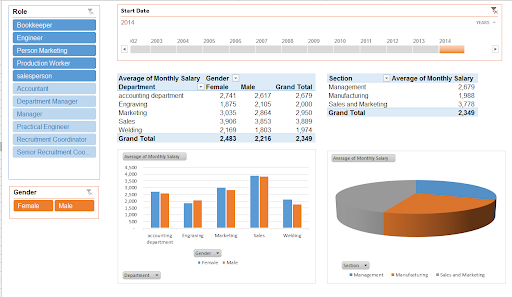
- Filters: Drag fields here to add filters to your pivot table, allowing you to focus on specific data subsets.
- Customize Your Pivot Table
- PivotTable Tools Ribbon: Use the Design and Analyze tabs to customize the look and functionality of your pivot table.
- Sort and Filter: Click on the drop-down arrows in the pivot table to sort and filter your data.
- Value Field Settings: Click on the value field to access settings where you can change the summary function (e.g., from SUM to AVERAGE).
- Refreshing Data
- If your underlying data changes, you can refresh the pivot table to reflect the updates. Simply click on the pivot table, go to the Analyze tab, and click Refresh.
Benefits of Using Pivot Tables
- Efficient Data Analysis: Quickly summarize and analyze large datasets without complex formulas.
- Flexibility: Easily rearrange data to view it from different angles.
- Time-Saving: Automate data aggregation and calculation tasks.
Insightful Reports: Generate meaningful reports that highlight key trends and patterns.
Polar Backup: Protecting Your Excel Work
While working with important data in Excel, it’s crucial to ensure that your files are backed up and secure. Polar Backup offers an excellent solution for safeguarding your Excel spreadsheets and other critical business data. With features like AI Adaptive Storage and cost-effective plans, Polar Backup ensures that your data is protected against accidental deletion, corruption, and other potential data loss scenarios.
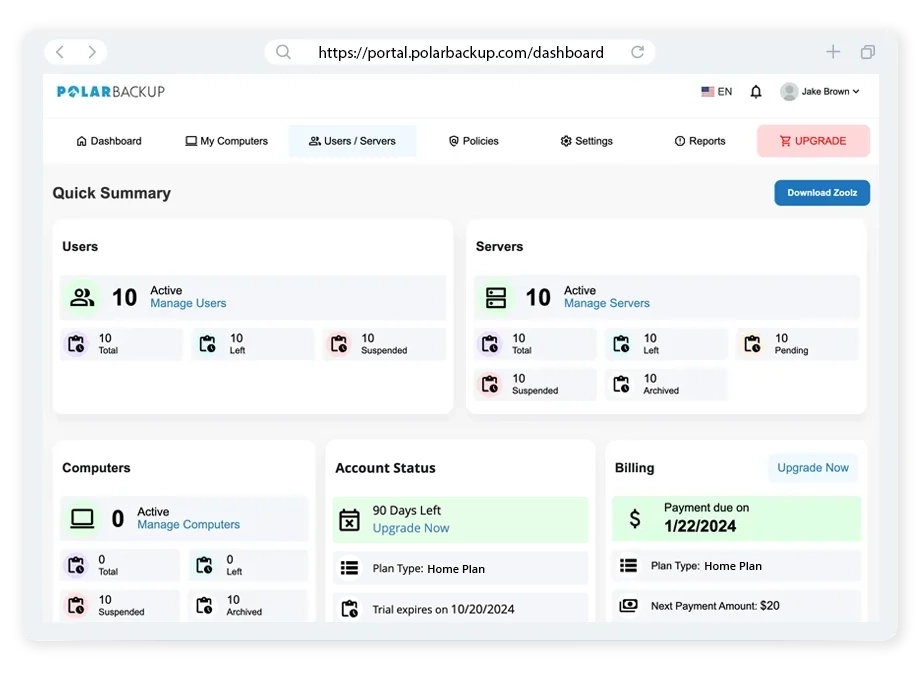
Key Benefits of Polar Backup:
- Automatic Backups: Schedule regular backups to ensure your files are always protected.
- Multiple Versions: Save multiple versions of your files, making it easy to recover the exact data you need.
- Secure Cloud Storage: Store your data in the cloud with advanced encryption for added security.
- AI Adaptive Storage: Optimize storage costs with intelligent data management, ensuring frequently accessed files are readily available and less-accessed files are stored more economically.
Conclusion
Pivot tables are an invaluable tool for anyone looking to make sense of large datasets in Excel. By following this guide, you can master the basics of creating and using pivot tables to enhance your data analysis capabilities. Remember, while working with crucial data, it’s essential to have a reliable backup solution like Polar Backup to safeguard your work and ensure you never lose valuable information. Start using pivot tables today and take your data analysis to the next level!